Statistics that
show their work.
Modellum runs your do-files, opens Stata and SPSS data, and explains every result with your own numbers. A modern, fast statistics package for research, at a fraction of what you're paying now.
At launch: a 30-day free trial, a free open-source engine, and the app from $39/year.
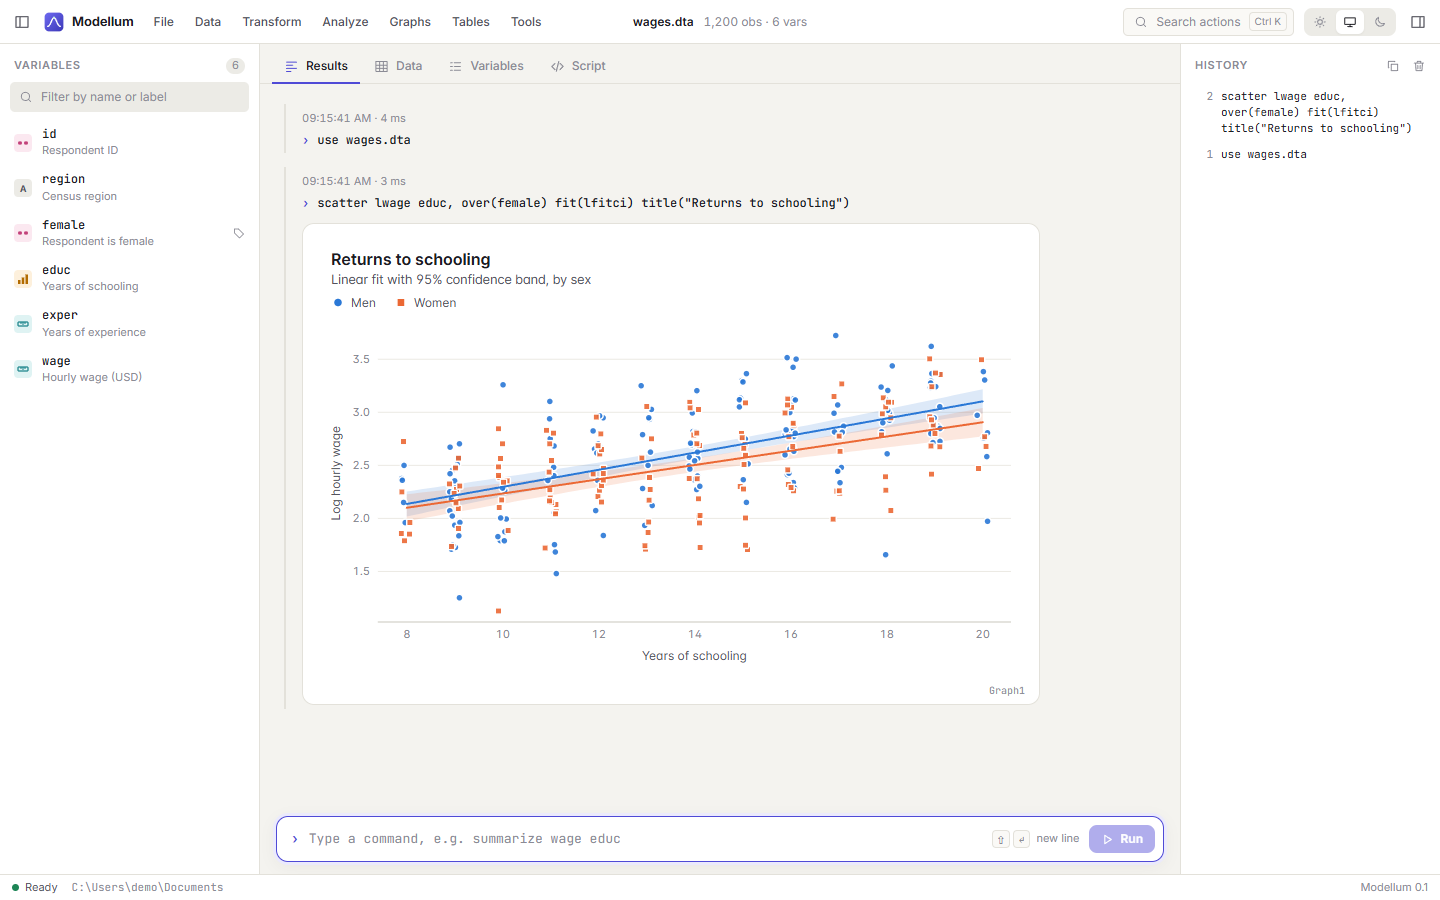
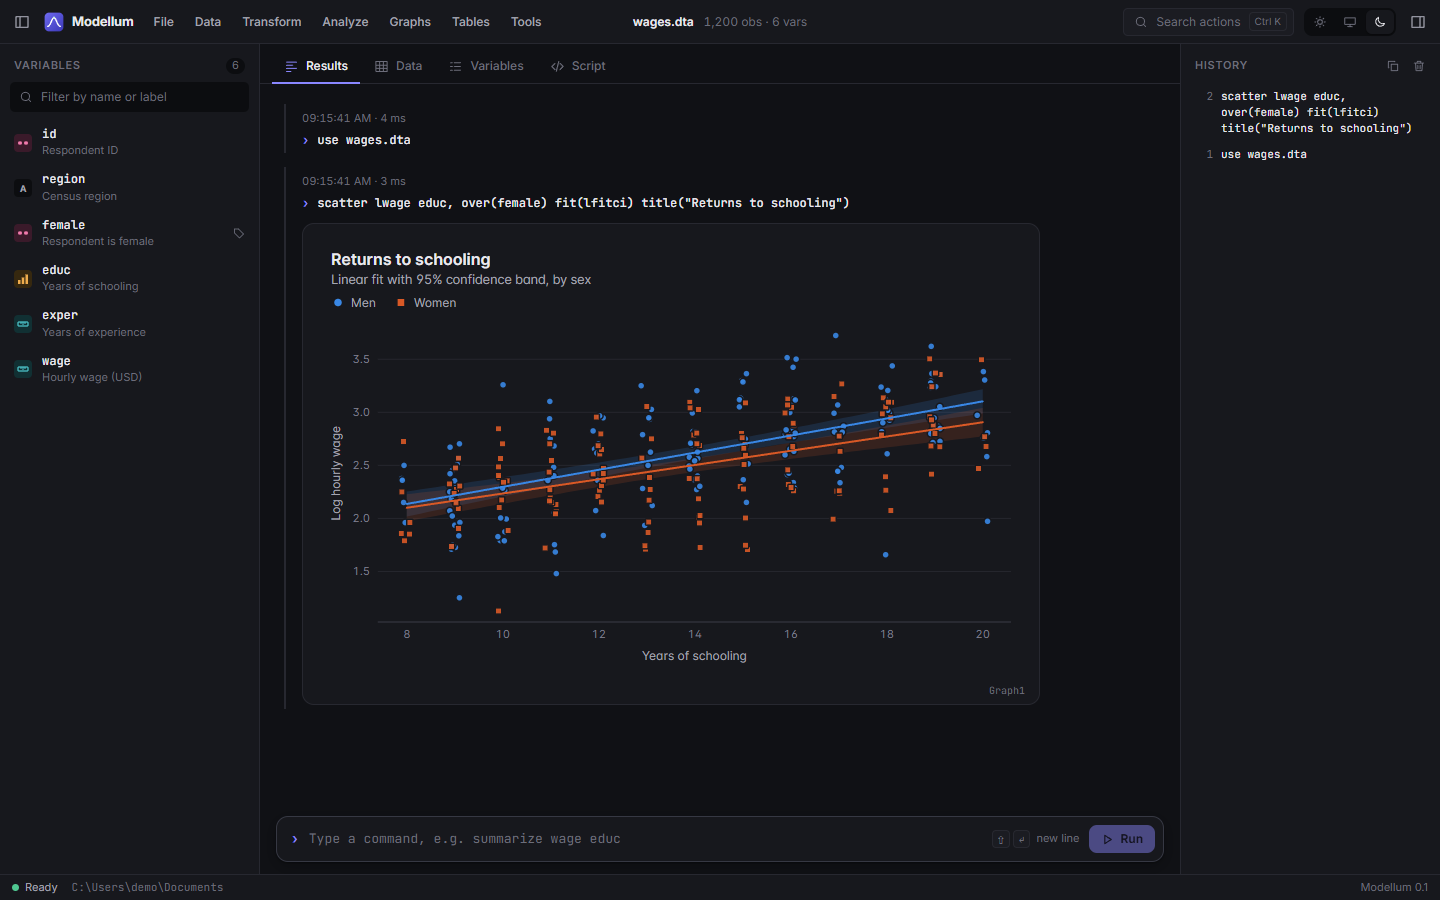
- Stata-style
- do-file syntax
- .dta & .sav
- read natively
- 57 NIST
- certified datasets pass
- All cores
- bit-identical results
A textbook that uses your data.
Add explain to a command and Modellum walks through how each number was computed: the formula, the intermediate quantities, and what the result does and doesn't tell you.
- Your sums of squares, your residuals, your degrees of freedom
- Each formula written out, with your values filled in
- Plain-language notes on what each number does and doesn't mean
Built for students learning methods and for anyone who has to defend a result to a reviewer.
. regress lwage educ exper female, explain
  (coefficient table omitted)
How these numbers were computed

 1. Total variation in the outcome
    SST = Σ(yᵢ − ȳ)² = 6.7207
    How much the outcome varies before we use any predictors.

 2. Variation the model leaves unexplained
    SSR = Σ(yᵢ − ŷᵢ)² = 3.5593
    OLS chooses the coefficients that make this as small as possible.

 3. Share of variation explained
    R² = 1 − SSR/SST = 1 − 3.5593/6.7207 = 0.4704
    R² says how well the line fits, not whether the model is causal or correct.

 4. Typical size of a residual
    σ̂ = √(SSR/(n − k)) = √(3.5593/34) = 0.3236
    We divide by n − k, not n, because estimating k coefficients used up k degrees of freedom.
Every click writes the command.
Menus and dialogs build real syntax, so what you do by hand is logged, repeatable, and one click away from becoming a do-file. Beginners pick up the language as they go; experts just type.
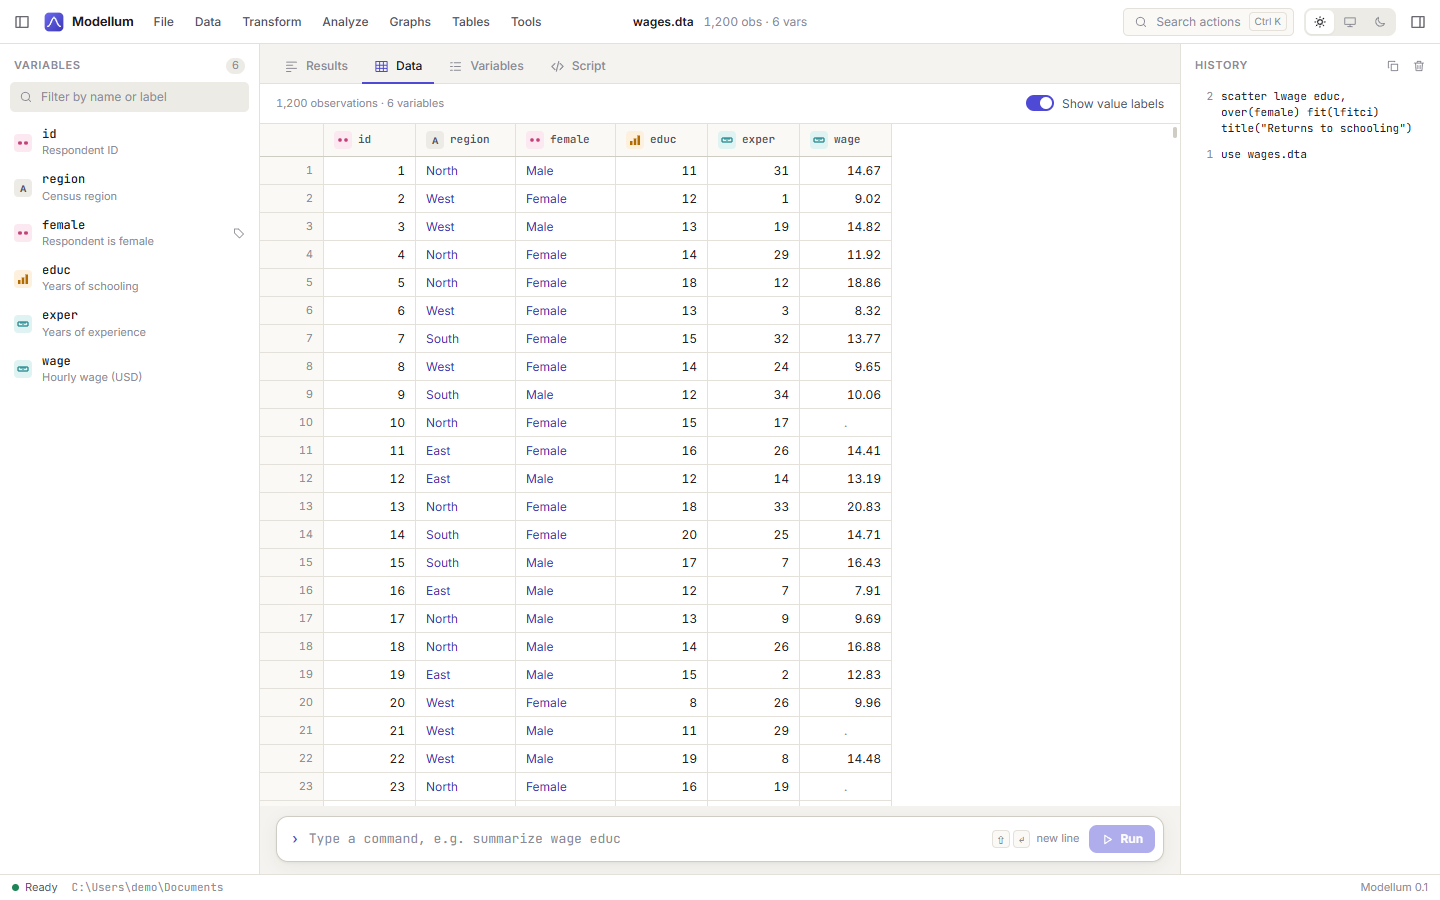
Variables, done right
Labels, value labels, missing-value codes, and nominal, ordinal or scale measurement levels, read straight from Stata and SPSS files.
Search every action
Press Ctrl K to find any procedure by name or by what you're trying to do, from "compare two groups" to "cluster-robust errors".
History becomes a script
Copy the commands that worked as a do-file. Rerun the whole analysis tomorrow, or hand it to a co-author.
. import delimited wages.csv, clear
(40 observations, 6 variables)

. generate lwage = ln(wage)
(2 missing values generated)

. regress lwage educ exper female, vce(robust)
Linear regression (robust standard errors, HC1)
  Number of obs  =         38
  F(3, 34)       =       6.82
  Prob > F       =     0.0010
  R-squared      =     0.4704
  Adj R-squared  =     0.4237
  Root MSE       =  0.3235504
 lwage  │  Coefficient   Std. err.      t  P>|t|    [95% conf.   interval]
────────┼──────────────────────────────────────────────────────────────────
 educ   │   0.07535133    0.016733   4.50  0.000    0.04134577   0.1093569
 exper  │   0.01424034  0.00717092   1.99  0.055  -0.000332719   0.0288134
 female │   -0.1470962  0.09886348  -1.49  0.146    -0.3480109  0.05381859
 _cons  │       1.2762   0.2889783   4.42  0.000     0.6889258    1.863475
The syntax you already know.
Same command names and abbreviations, if/in, varlists with wildcards, factor variables, macros, loops, program define, stored results in r() and e(). Most scripts port with few changes.
Modellum reads Stata .dta versions 114–119 and SPSS .sav, compressed or not, with readers written from the published specs and tested against files produced by other tools.
Enough to finish a thesis. Built to finish a career.
The procedures empirical researchers actually use, including the two that keep people on expensive software: margins and svy.
Regression & GLM
regress, logit, probit, poisson, glm (6 families × 6 links), nbreg, nl, with robust and clustered errors
margins & tests
Predictive margins, marginal effects, marginsplot, test, testparm, lincom, contrast, pwcompare
Survey data
svyset with strata, PSUs, fpc and replicate weights; svy: means, tabulations and regressions
Panel & IV
xtreg fe/re/be, hausman, ivregress 2sls/liml/gmm with first-stage, overid and endogeneity tests
Survival
stset, Kaplan–Meier, log-rank tests, stcox with Efron ties and phtest, parametric streg
ANOVA & multivariate
Type III ANOVA, repeated measures with sphericity corrections, MANOVA, Hotelling, mvtest
Measurement
pca, factor (pf, ipf, pcf, ml), varimax and promax rotation, Cronbach's alpha, KMO
Nonparametric
Rank-sum with exact p-values, signed-rank, Kruskal–Wallis, median, Spearman, Kendall
Publication output
esttab to Word, LaTeX, Markdown or CSV; graphs to SVG, PNG and PDF with embedded fonts
Figures that are ready for the journal.
One renderer draws every graph, so it looks the same on screen, in PNG, and in vector SVG or PDF. Colours are checked for colour-vision deficiency, and series differ by marker shape as well as colour.
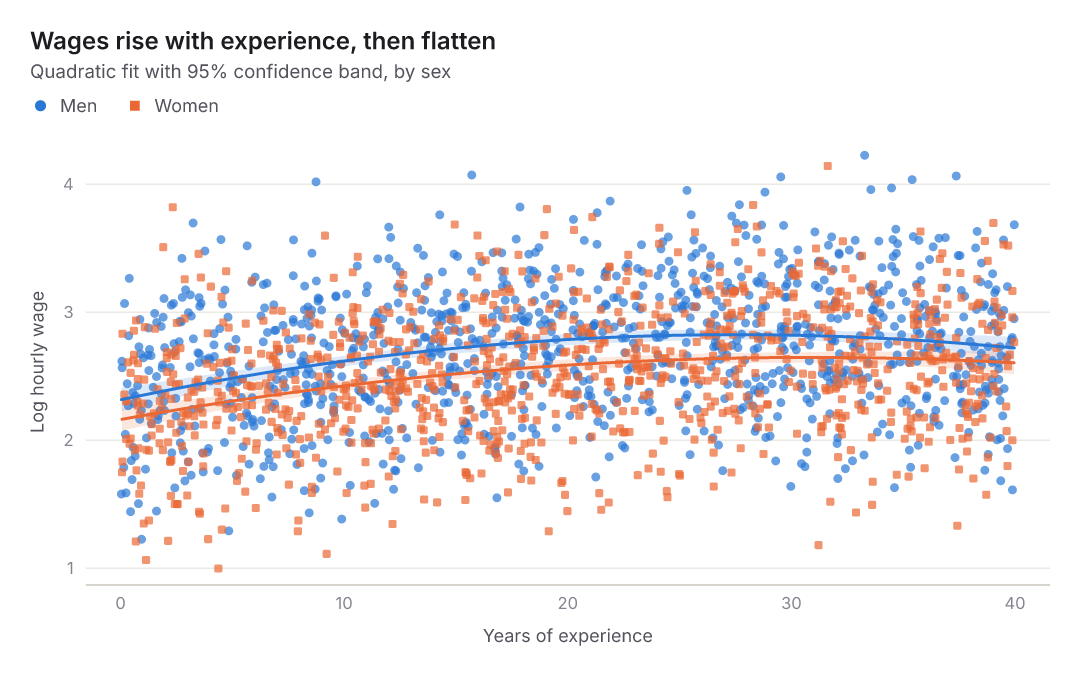
scatter lwage exper, over(female) fit(qfitci)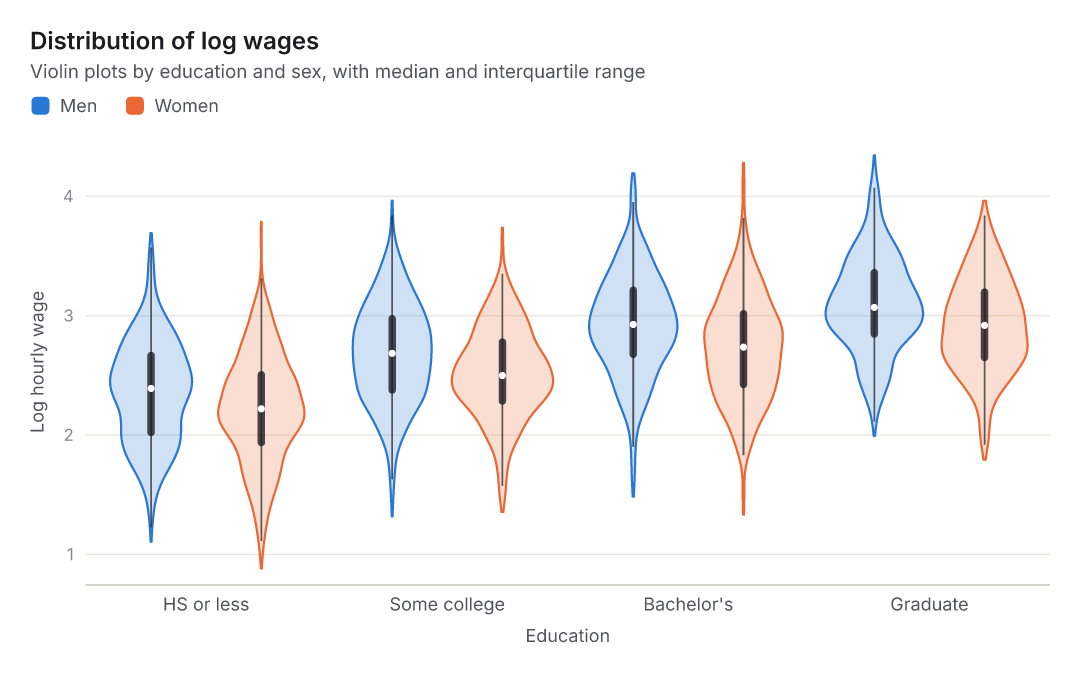
violin lwage, over(edcat) over(female)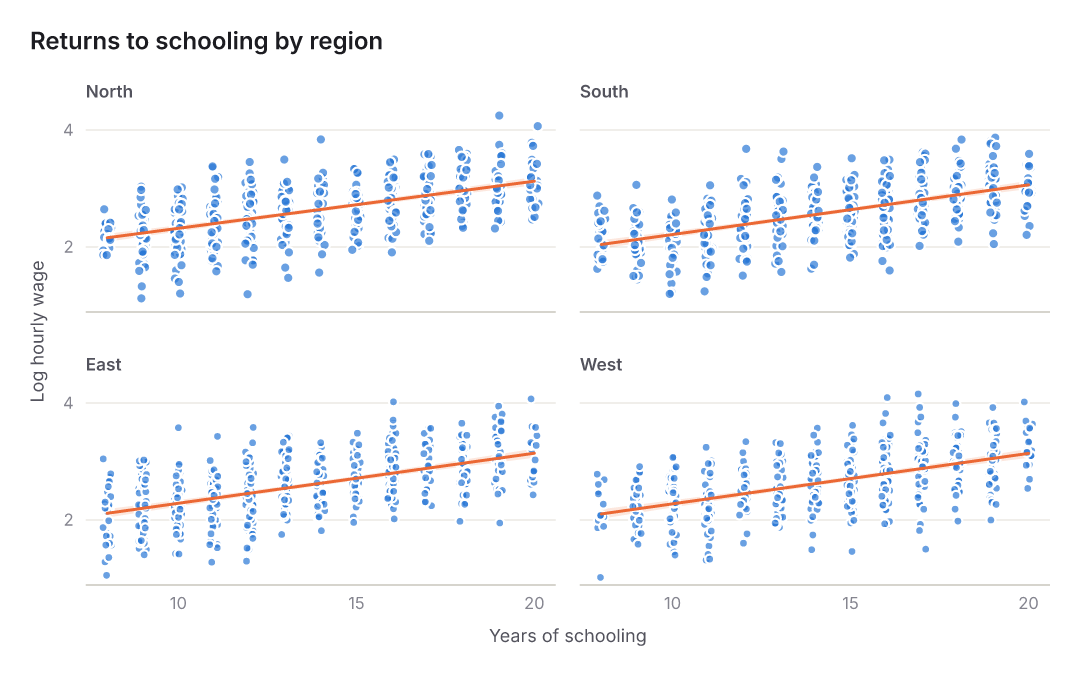
twoway (scatter lwage educ) (lfitci lwage educ), by(region)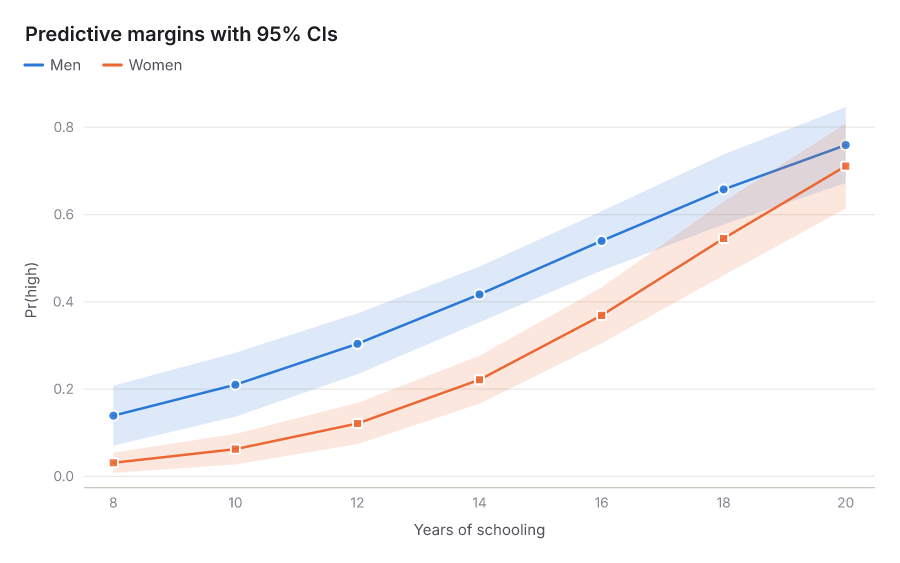
margins after logit, then marginsplotUses every core you paid for.
Written in Rust. Expressions, grouping, least squares and the iterative models run in parallel, and results are bit-identical whatever the thread count, random draws included. Large least-squares problems can use an NVIDIA GPU.
Measured with the benchmarks in the Modellum repository.
Validated in public
- All NIST StRD linear regression, ANOVA, univariate and nonlinear datasets run on every change
- Stata's published survey design-effect examples reproduce to every printed digit
- Hundreds of random expressions must give identical bits on 1 thread and on all of them
- GPU results must match the CPU to 10⁻¹⁰ and drop the same collinear columns
Loops, macros and stored results.
Collect estimates across subgroups, compare models side by side, and export the table straight to Word or LaTeX in the house style journals expect.
esttab writes three-rule academic tables with superscript stars to.docx, booktabs to .tex, or Markdown and CSV.
. foreach g in 0 1 {
  2.   quietly regress lwage educ exper exper2 if female == `g', robust
  3.   scalar ret`g' = 100 * (exp(_b[educ]) - 1)
  4.   display "Return to schooling, female==`g': " %5.2f ret`g' "%"
  5. }
Return to schooling, female==0:  6.50%
Return to schooling, female==1:  9.79%

. quietly regress lwage educ

. estimates store m1

. quietly regress lwage educ exper female, robust

. estimates store m2

. estimates table m1 m2, se stats(N r2) b(%9.3f)
 Variable │       m1       m2
──────────┼───────────────────
 educ     │    0.077    0.075
          │  (0.018)  (0.017)
 exper    │             0.014
          │           (0.007)
 female   │            -0.147
          │           (0.099)
 _cons    │    1.404    1.276
          │  (0.263)  (0.289)
──────────┼───────────────────
 N        │       38       38
 r2       │    0.349    0.470
legend: b / (se)
Free where it matters for science.
The statistics engine and command-line tool are open source, so anyone can check the math and rerun a published analysis without a license. The desktop app is how Modellum pays for itself: $39/year for students, with perpetual licenses for those who hate subscriptions.